Affiliate Disclosure: This post may include affiliate links. If you click and make a purchase, I may earn a small commission at no extra cost to you.
Want to test what your SSD is capable of doing? You can use an SSD benchmark software. There are many software programs you can use to do so. Some are free, while others are paid. With these software tools, we can put our SSDs through synthetic and real-world test environments to evaluate their performance, efficiency, and impact on our daily tasks.
Before benchmarking an SSD, it is essential to understand the benchmark parameters you select for the tests and to get the results. All the SSD benchmarking software we discuss here will differ slightly and serve their own purposes. For example, PCMark 10 and 3DMark are used for checking your drive’s performance for different tasks. One is for general purposes, while one is specifically for gamers.
However, I haven’t just provided you with a list of the tools and their links. I have tried to guide you on how you can benchmark your SSD using these software. So, without any further delay, let’s get started.
Also Check: Best SSD Monitoring and Health-Check Software
1. CrystalDiskMark
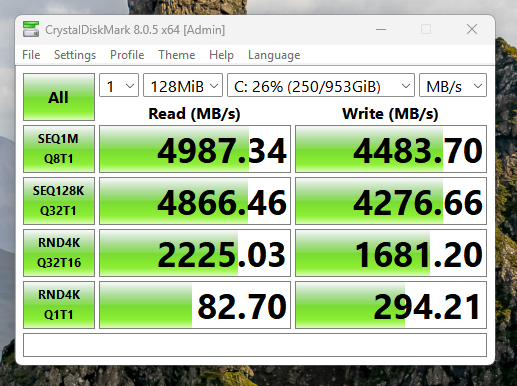
CrystalDiskMark, or CDM, is a popular SSD and HDD benchmarking tool for Windows. It measures the sequential and random read/write performance of our drives. CDM does its job by reading and writing blocks of data to the drive we want to benchmark. The results consist mainly of four parameters: Sequential speeds (large files), Random speeds (small, scattered files), Queue depths & thread performance (how well the drive handles multiple requests).
| Pros | Cons |
|---|---|
| Simple, repeatable synthetic workloads (sequential + random) make it ideal for comparative testing. | Overstates real-world sustained performance, especially on TLC/QLC SSDs. |
| Supports configurable QD and thread count, reflecting NVMe parallelism fairly well. | Lacks mixed-QD profiles. Can’t emulate real client workloads that fluctuate between QD1–QD32. |
| Provides clear differentiation between sequential and random I/O. | Fails to capture garbage collection or thermal throttling behavior |
| Suitable for identifying SLC cache saturation if the test size exceeds the DRAM buffer. | No graph views available |
Step-by-Step SSD Benchmarking Process using CDM
CrystalDiskMark is easy to use and generally doesn’t require you to change any settings for normal tests. It provides the functionality for customized benchmarks, but that is for high-end users. You also get custom profiles with pre-defined settings.
Step 1: Selecting the Storage Device
- The user selects the drive to be tested from the drop-down menu given at the top.
- CDM automatically identifies the drive type (NVMe, SATA SSD, HDD, etc.).
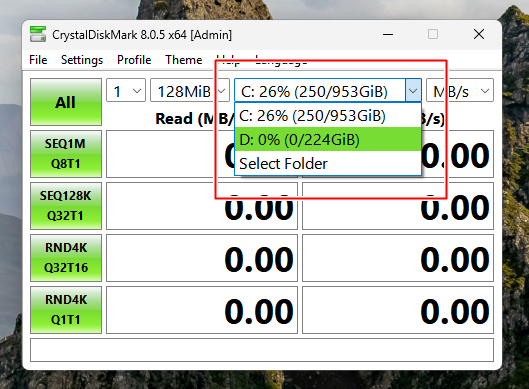
Keep in mind that if the drive is an OS drive (C:), Windows background processes might slightly affect results.
Step 2: Choosing Test Parameters
The user can configure different settings and choose various test profiles.
Choosing Benchmark Profiles
There are 10 pre-defined profiles to help you put your SSD in different test scenarios. Peak performance, real-world performance, and mixed performance are the most utilized ones. However, most people would keep the settings on default.
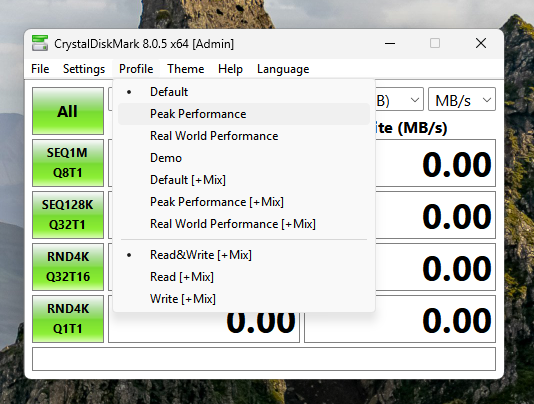
In my opinion, most people don’t have to dig deeper into the custom benchmark settings because they’ll have to understand the concepts first. We will try to do that below, but these benchmark profiles are more than enough to get the most out of this software’s capabilities.
Custom Benchmark Settings
If you know, fine-tune your benchmark using custom block size, queues, threads, measurement time, and interval timings. You can go to Settings options in the Settings menu. There, you can adjust all these settings as per your choice.
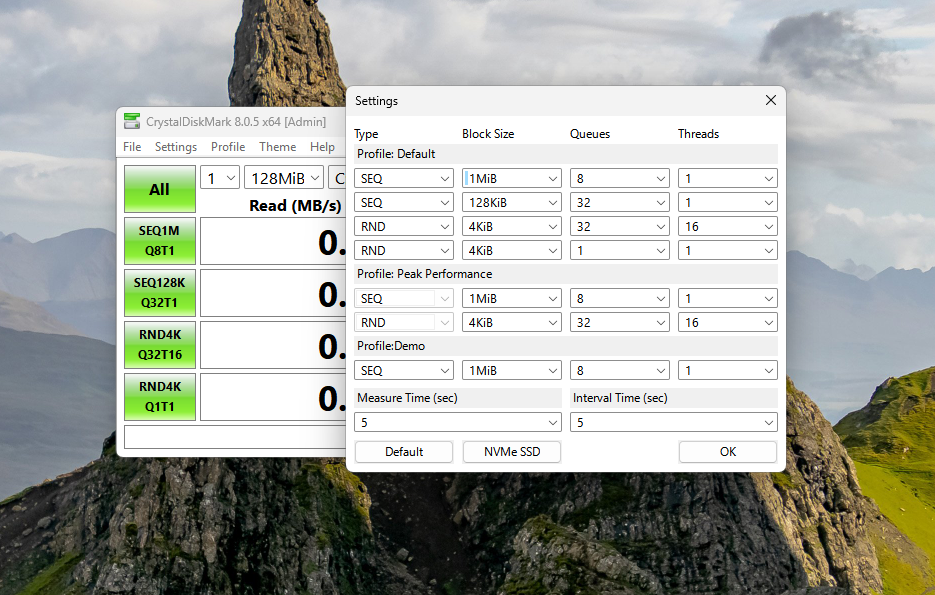
In the custom settings, you get the option to change the test type, block size, queues, and threads. The Test Type simply allows you to choose between sequential and random tests.
- Sequential: Data is written contiguously (e.g., copying movies).
- Random: Data is scattered randomly across the SSD (e.g., OS tasks, gaming).
In simple words, random data and speed depict more of the daily tasks that we do on our computers. Sequential is mostly about moving heavy files of the same type here and there.
Block Size is the size of chunks of data read/written at a time. For example, a 1MiB file size is considered large and suitable for sequential tests. However, a 4KB file size is for a random benchmark, which is a smaller size of data. You can set the block size between 4KiB and 8MiB.
Queue Depth is the number of pending read/write requests waiting to be processed by a drive. QD1 is considered low queue depth and simulates normal workloads like gaming, editing, operating systems, or other normal tasks. A queue Depth of 32 or more simulates the server and database workloads. In CrystalDiskMark custom settings, you can set the queue depth between 1 to 512.
Threads represent the number of tasks going on simultaneously. You can set it between 1 and 64, where 1 thread simulates basic file transfer and everyday computing, while 16+ threads depict professional workloads and heavy multitasking.
Results
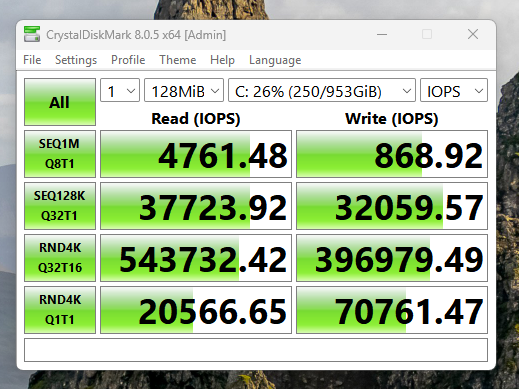
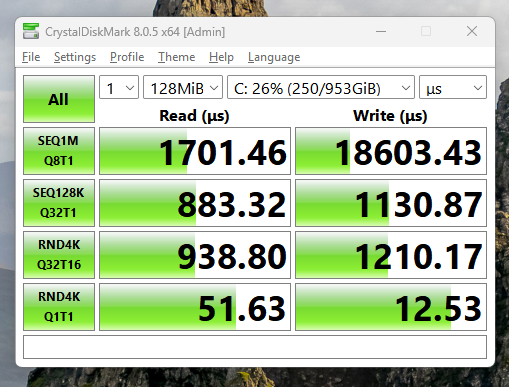
You can get the benchmark results in 4 formats, i.e., MB/s, GB/s, IOPS, and µs. MB/s and GB/s give you the highest speed that this drive achieved. However, the IOPS is great for understanding the random performance and how many read/write operations a storage device can handle per second. Latency (µs) shows how long (in microseconds) it takes for a storage device to complete a single I/O operation.
2. AS SSD Benchmark
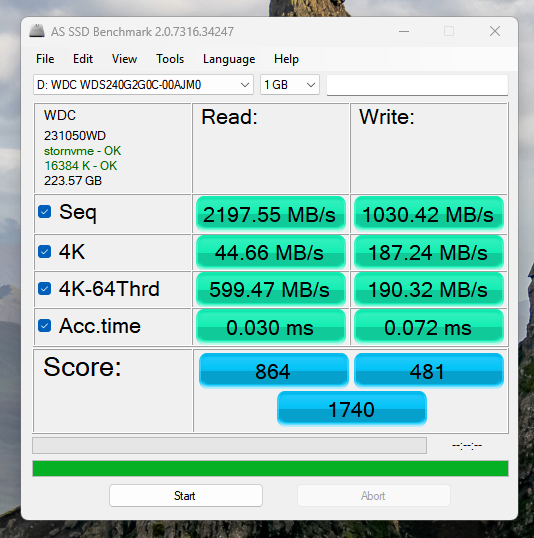
AS SSD is much simpler than CrystalDiskMark in terms of usability and features as well. You don’t get many options to change the test parameters. The results are easy to understand
| Pros | Cons |
|---|---|
| Uses incompressible data to expose real NAND write performance. | Unrealistically sustained workloads |
| Fixed QD patterns make it easy to compare SATA drives consistently. | Doesn’t scale beyond SATA-typical QDs |
| Test sequential, 4K, and copy scenarios separately. | Copy tests mix file sizes and access types. Results can be erratic. |
| Reveals controller compression tricks and firmware caching limits. | Lacks extended-duration tests to show garbage collection or steady-state behavior. |
Step-by-Step SSD Benchmarking Process using AS SSD Benchmark
With the AS SSD benchmark, you can just tick or untick the test parameters if you want to run them or not. However, you can change the file size at which the test is run. The default test size is 1GB, but you can change it to 3GB, 5GB, or 10 GB.
The 1GB test has a quick turnaround time. However, the write results can be affected by the SLC cache or DRAM. Higher file sizes, i.e., 3GB or more, will bypass the cache and provide you with more realistic results.
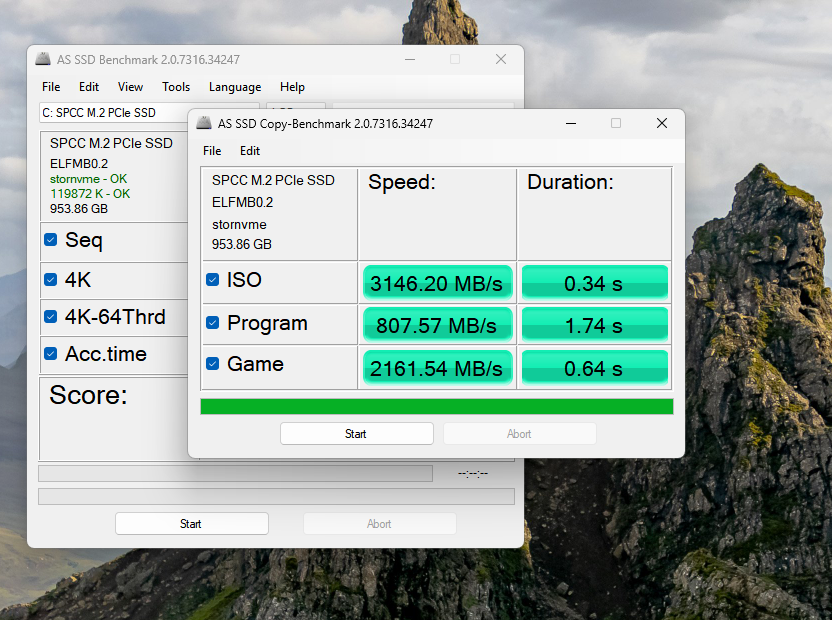
If you go to the Tools section in the AS SSD main menu, you’ll find two separate test options, i.e., Copy Benchmark and Compression Benchmark.
Copy Benchmark
The Copy benchmark test gives three results, i.e., ISO, Program, and Game. The ISO test copies two large sequential files to measure the sequential read and write performance. This test gives you the speed and the total time to move that file. The Program test simulates loading an application with multiple small files. The purpose is to check an SSD’s performance in loading and launching programs. The Game Test simulates loading gaming assets like maps, environments, audio, etc. It shows how well a game can handle gaming tasks, specifically the loading times.
These results can be better understood when you compare them with other drives. Standalone, they just give you the numbers, which are of no use to you in the real world.
Compression Benchmark
AS SSD comes with a dedicated compression benchmark as well. The selected file size would apply here as well. It gives you the result in the form of a graph, starting from 0% compression to 100%.
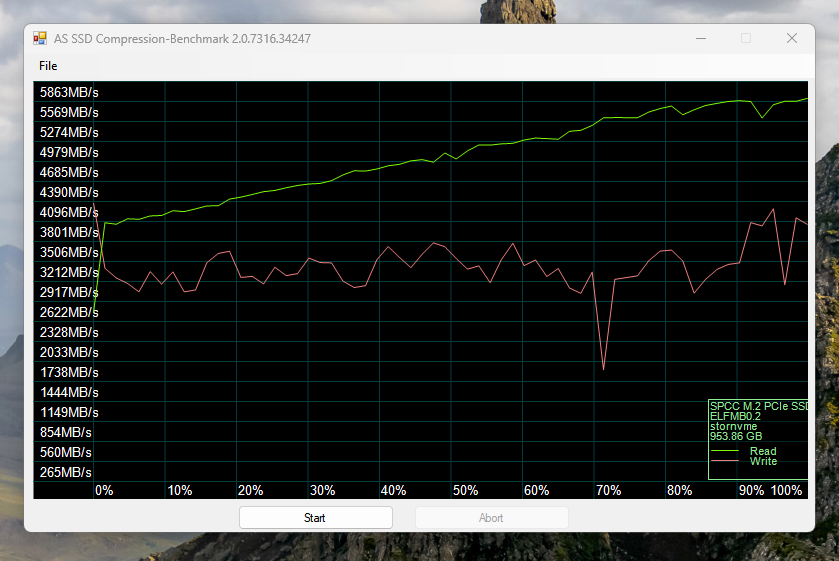
The results can be hard to understand, but keep in mind that a straight line is always ideal. Some SSDs handle compression much better than others, especially the ones that use controller-based compression. If the drive is showing a drop to the right side, i.e., towards higher compression, it means the drive is struggling with incompressible data like encrypted files or video files. Some SSDs show a sudden drop in write speed because of the controller-based encryption.
3. ATTO Disk Benchmark
The ATTO Disk Benchmark is also a pretty popular benchmarking software for SSDs, HDDs, Flash drives, RAIDs, and most other storage drives. Compared to the CDM and AS SSD software, the ATTO Disk benchmark has many more features, including multiple file sizes, queue depth customization, direct I/O, overlapped I/O, etc. You also get the option to bypass the cache and verify data. For I/O sizes, you can adjust the range or set it to a single size ranging from 512 bytes to 64 Megabytes.
| Pros | Cons |
|---|---|
| Tests I/O sizes from 512B to several MB. Good for testing raw throughput | Uses highly compressible data which masks write-compression penalties on many controllers. |
| Allows tuning of QD and overlap settings to study scaling behavior. | Uses highly compressible data, which masks write-compression penalties on many controllers. |
| Sequential-only design is ideal for bandwidth testing and RAID tuning. | No random or mixed I/O testing |
| Granular per-block-size performance graphs. | No latency or IOPS data for deeper analysis. |
It feels more like adjusting the Queue depth, file size, and I/O size manually, but you won’t find it tough at all. Let’s see what you get in the ATTO Disk benchmark.
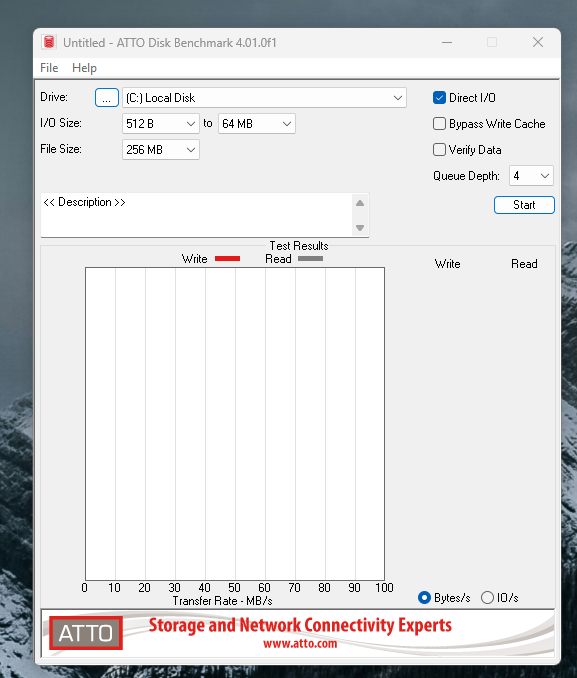
Step-by-Step SSD Benchmarking Process using ATTO Disk Benchmark
First of all, you choose the drive you want to benchmark. Then, it’s time to choose the I/O size. You get two dropdowns to set a range. However, if you want, you can set both of them to one I/O number, and it will give you the results for the single I/O. I/O is the block size that tests an SSD’s performance with different sizes of data. The file size can be adjusted between 64KB and 32 GB.
You can turn Direct I/O on or off, enabling or disabling the OS’s system cache. So, with this feature turned off, you can expect raw results. However, the other option, i.e., Bypass Write cache, prevents the SSDs from using their dedicated write cache and does the read/write operations at the raw speed. The Verify Data option ensures data integrity by confirming whether the written data matches the read data. It is useful for checking the bad blocks and other storage issues as well.
You should keep the verify data option disabled unless you are testing for drive integrity.

The results can be seen in Bytes/s or IO/s. It gives you both read and write scores for each I/O selected in the range, in this case, 512B to 128 KB.
4. Blackmagic Disk Speed Test (Mac)
Blackmagic Disk Speed Test is a popular storage benchmarking tool designed primarily for macOS. This software is mainly used for video production workflows and for professionals like filmmakers, video editors, VFX designers, and content creators. In terms of benchmark functionality, there isn’t much to customize.
| Pros | Cons |
|---|---|
| Uses large sequential transfers that reflect real video workflow I/O. | Not representative of general system or app loads. |
| macOS I/O stack handles queues transparently, avoiding driver overhead bias. | No control over QD or thread count |
| Realistic for sustained write/read of large media files. | Can’t expose controller-level caching or SLC exhaustion. |
| Good at revealing sustained throughput and thermal throttling on long writes. | No visibility into latency, IOPS consistency, or firmware-induced stalls. |
| Simple output showing codec-based thresholds (ProRes, DNxHR, etc.). | Hides true bandwidth, latency histograms, or queue efficiency. |
You can, however, change the test file size or what they call the stress. You can set it between 1 GB and 5 GB.
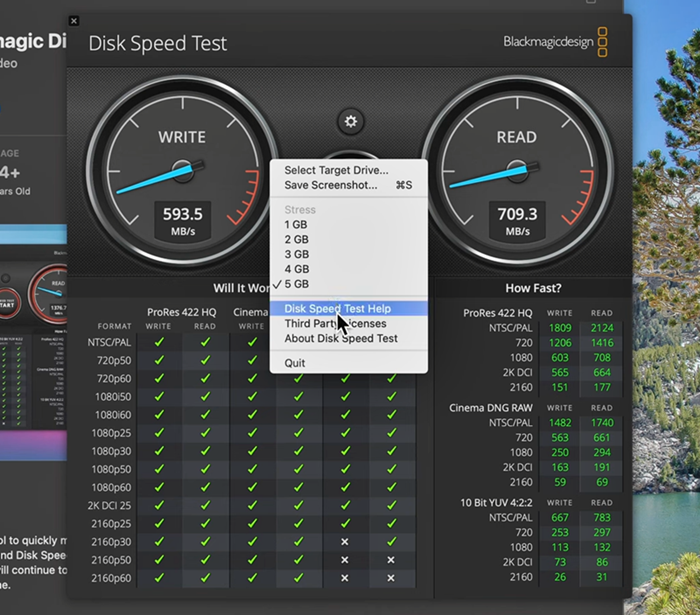
The output gives the read/write speed as well as the supported video formats. For each file format, the tested read-write scores are provided.
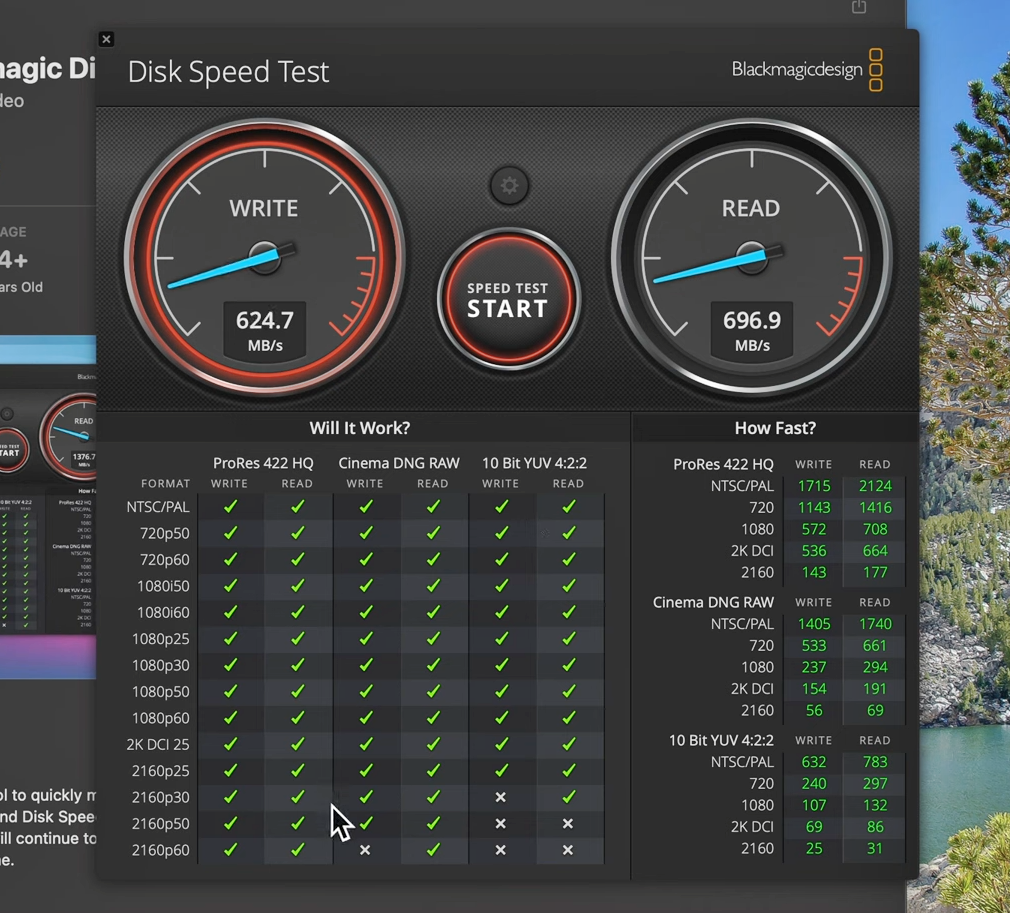
The best use case of this software is to check whether an SSD is fast enough for 4K and 8K editing. Also, external drives can be benchmarked.
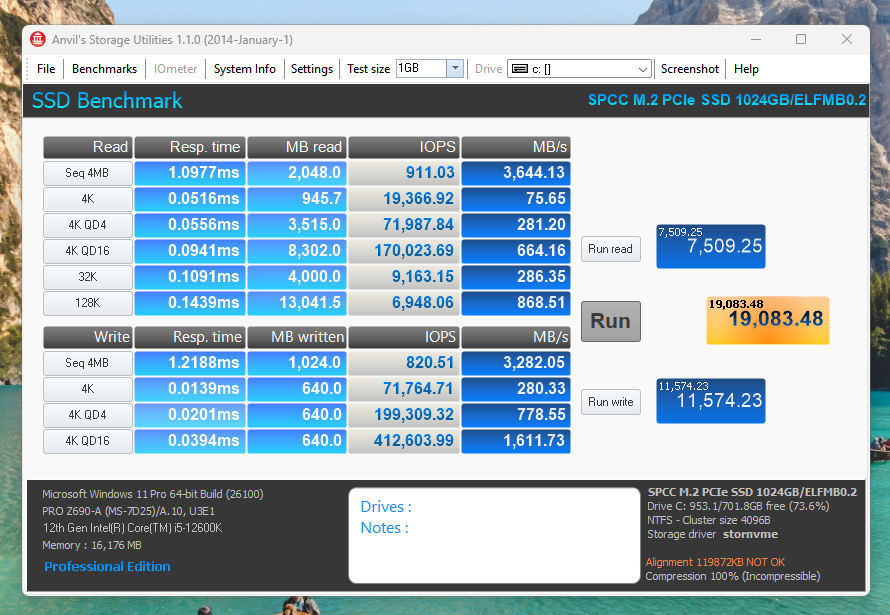
5. Anvil’s Storage Utilities (Windows)
Anvil’s Storage Benchmark is a comprehensive benchmark software that gives us many details about our drives. We can simply run the ordinary SSD benchmark or do SSD endurance testing. Threaded I/O read and write tests are also available. You can also customize compression percentages. The test size can be set from 1 GB to 32 GB.
| Pros | Cons |
|---|---|
| Mixes read/write and sequential/random operations | Test durations are short |
| Covers QD1–QD32 range with multithreaded scaling, good for NVMe evaluation. | Limited control over mixed-QD sequences |
| Synthetic nature still lacks real file-system interaction and OS-level caching effects. | Doesn’t monitor temperature or throttling — blind to thermal-induced dips. |
| Works across SATA and NVMe; simple setup with rich output. | Windows-only; relies on legacy APIs that can bottleneck high-end NVMe drives. |
In the SSD benchmark, we get read response time, speed, and IOPS. The read parameters are Seq 4MB, 4K 4K QD4, 4K QD16, 32K, and 128 K. The write parameters are Seq 4MB, 4K, 4K QD4, and 4K QD16. You can also run the read-and-write tests separately if you want. You get a read score, a write score, and a combined score as well in the results.
6. PCMark 10
PCMark 10 is another comprehensive tool that tests the system’s overall performance. It simulates real-world tasks such as browsing, video editing, file copying, and office work. But we are going to focus on its capabilities as a storage benchmark tool. The storage benchmark in PCMark 10 is available only with its Professional variant.
| Pros | Cons |
|---|---|
| Uses real-world traces from apps like Photoshop, Office, and games | Can’t tweak block size, QD, or data compressibility for deeper analysis. |
| Replays mixed-QD operations that mirror desktop usage patterns well. | QD scaling limited to consumer workloads |
| Balanced mix of random/sequential and read/write operations; reflects OS and app behavior. | Heavily read-dominant — underrepresents sustained write and cache recovery scenarios. |
| Modern 64-bit benchmark with NVMe and SATA support, minimal driver interference. | Windows-only |
There are three types of storage benchmarks you can run with PCMark 10:
1. Quick System Drive Benchmark
The quick system drive benchmark takes around 20 minutes to complete and has basic tests with less demanding real-world traces. In total, this benchmark writes around 23 GB of data to the drive, which gets deleted once the test is over. A minimum of 10GB of free space with a quad-core CPU and 4 GB of RAM is required to run this test.
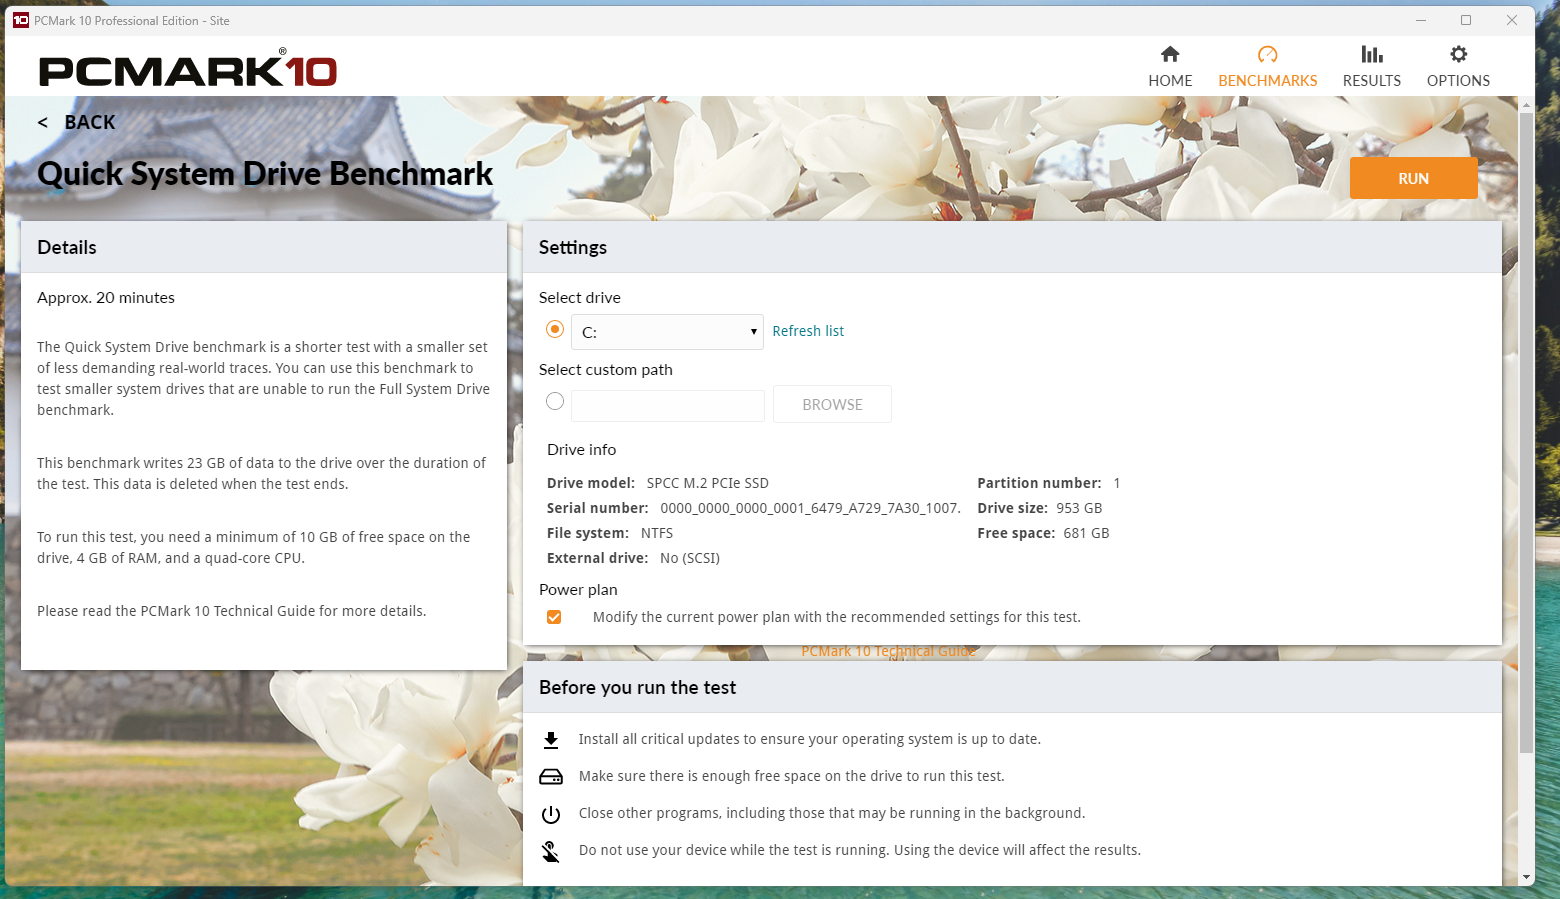
There is nothing much to select before you start this test because it is automatic. You just select your drive to benchmark and the RUN button. The test will start automatically, and you will see the results like this.

Full System Drive Benchmark
The Full System Drive Benchmark on PCMARK10 takes around 1 hour to complete. It writes a total of 204 GB of data in total. This benchmark tests the drive under a wide range of real-world traces from popular software. For this test, your system should have at least 80GB of free space, along with 8GB of RAM and a quad-core CPU.
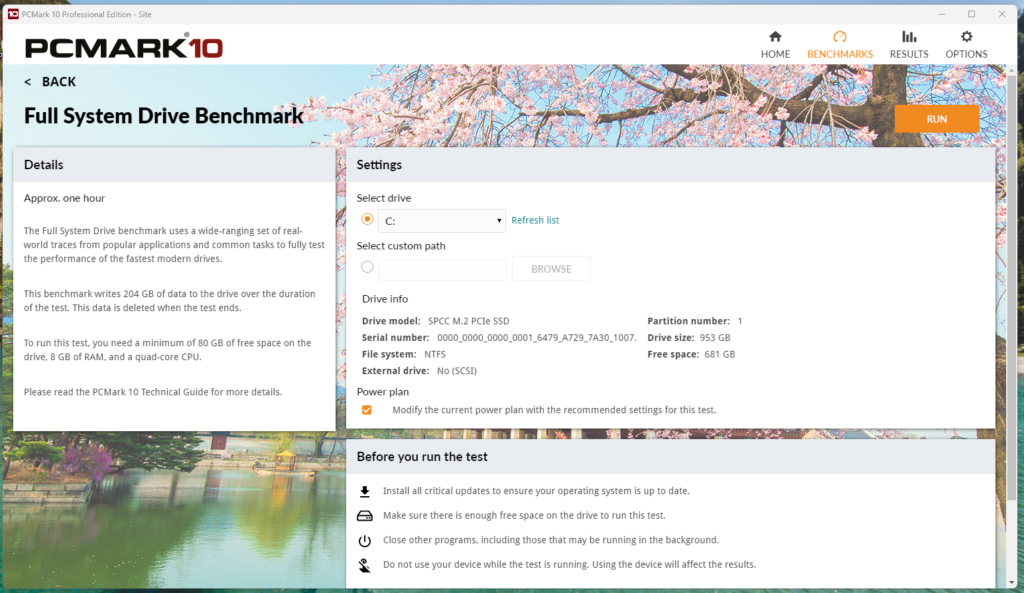
Again, you just select your drive for benchmarking and hit the RUN button. The test will start, and you will see the results.
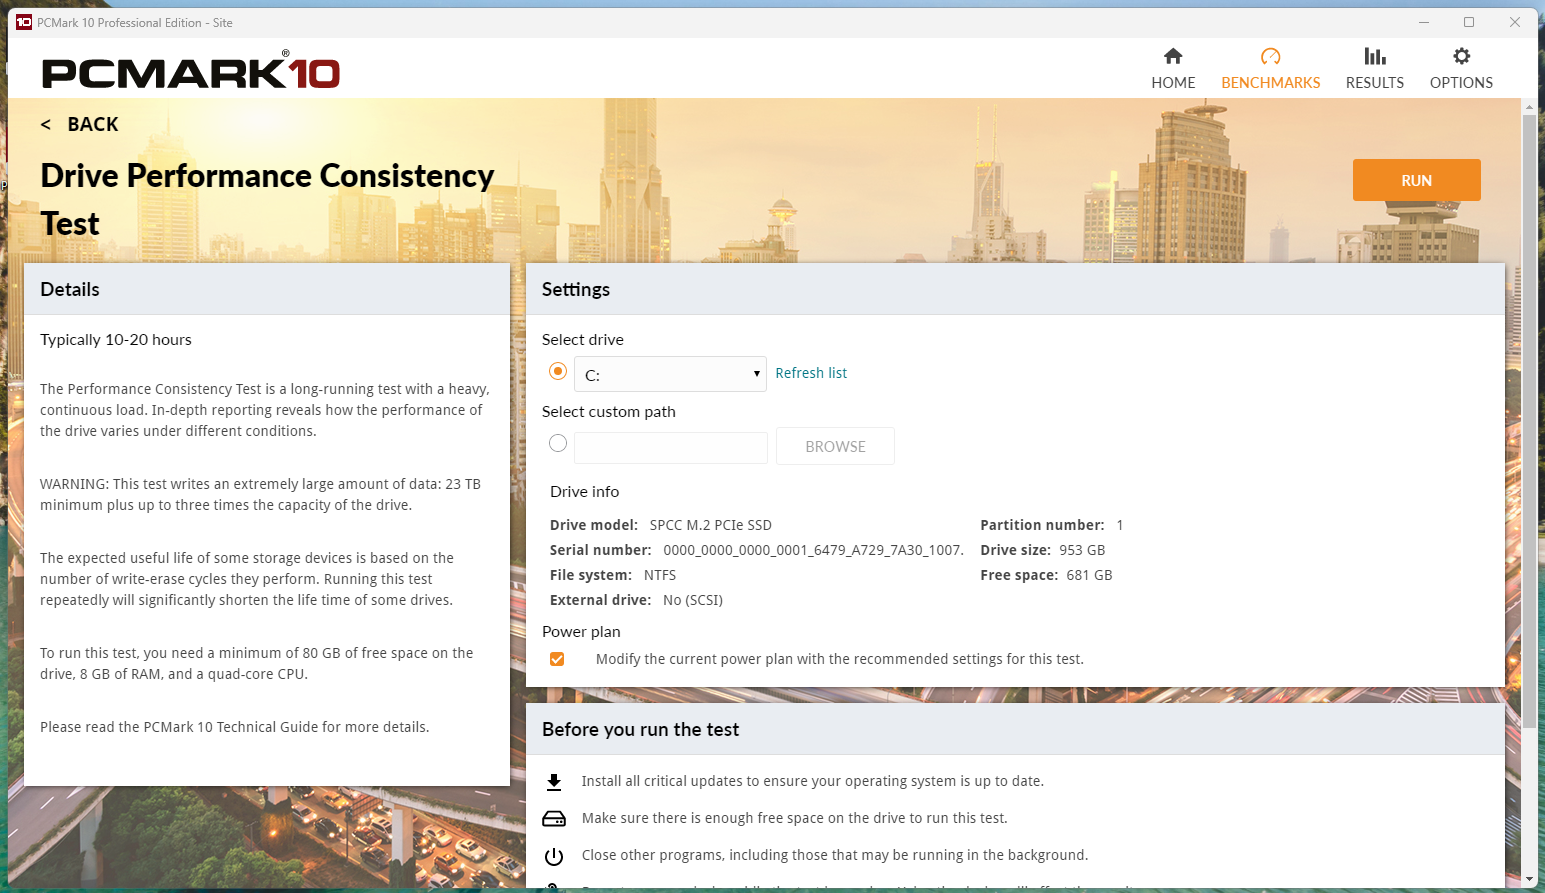
Drive Performance consistency test
This is a comprehensive test that runs for around 10 hours. It puts the SSDs through a heavy and continuous load and gives us in-depth insights into their performance. This test writes 23TB of data to the drive. It can write data up to 3 times the total drive space. However, it can significantly reduce the lifespan of your SSD in some drives with less TBW. To run this test, you need at least 80GB of free space on an SSD with 8 GB of RAM and a quad-core CPU or higher.
PCMark 10 is the best benchmarking software (paid) with realistic results that depict how well an SSD will perform in real-world applications. If you want to test your SSD in the best way possible, you can’t do it without PCMark. It gives you an overall score that you can compare
7. 3D Mark Storage Test for Gamers
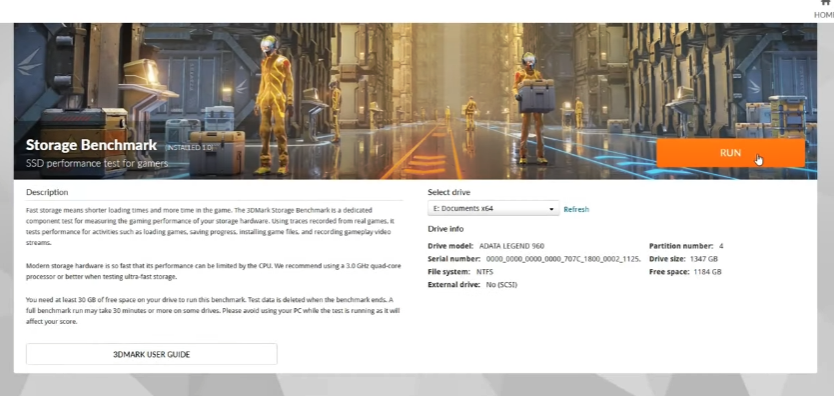
3D Mark Storage Test is another paid benchmark software designed specifically for gaming computers. The Time Spy test is the most popular and effective tool for testing your system’s gaming capabilities. However, there is a dedicated storage test that tests your SSD’s performance in gaming scenarios.
| Pros | Cons |
|---|---|
| Uses captured game load traces (Battlefield, Call of Duty, etc.) which reflects real gaming workloads well. | Results skew toward certain game engines and asset streaming behaviors. |
| Realistic low-QD access patterns (QD1–QD4) match typical gaming I/O. | No high-QD or parallel-thread scaling. |
| Emulates texture loading, save-game access, and level streaming accurately. | Ignores background OS writes, shader compilation, or patch installs |
| Reveals firmware latency and caching performance under real access bursts. | Doesn’t sustain tests long enough to expose throttling, SLC exhaustion, or garbage collection. |
Just like the PCMark 10, you have to select your drive and hit RUN to perform the benchmark test. Everything will happen automatically.
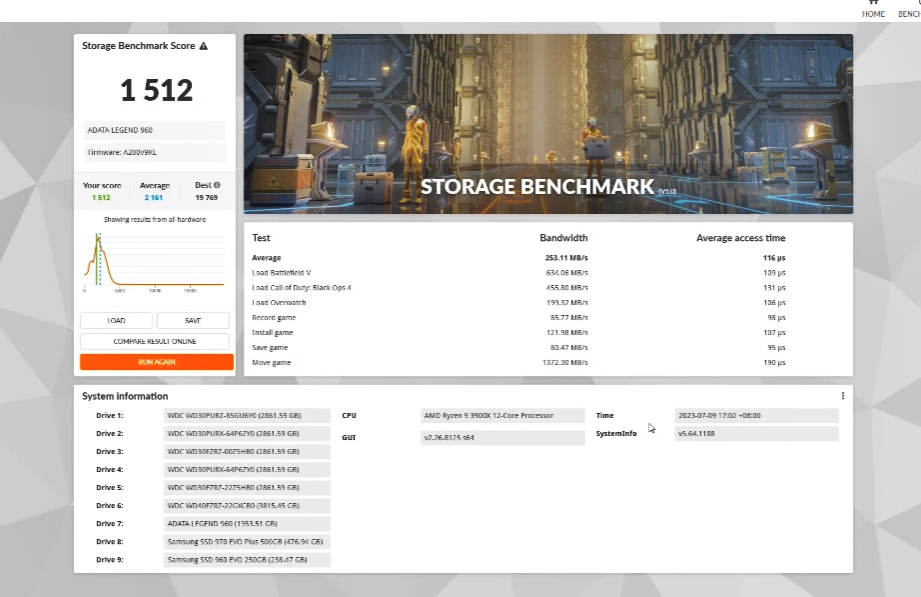
This test measures your drive’s performance in gaming-related tasks such as loading games, saving progress, and moving the game. It does that for multiple games, like Battlefield, COD, and Overwatch. In the results, you get an overall benchmark score that you can easily compare online with other systems. Also, you see the total bandwidth in different games and gaming tasks along with the average access time.
8. DiskBench
DiskBench is another free, easy-to-use benchmarking tool for SSDs, HDDs, USB drives, and network storage devices. This software is pretty basic, with five test types. The Copy File and Copy Directory are essentially the same tests, using different file types.
| Pros | Cons |
|---|---|
| Uses actual file copy, read, and write operations | Results depend on OS caching and file system state |
| Perfect for simulating desktop workloads because it operates at true QD1. | Can’t evaluate NVMe parallelism because of no multithreaded or mixed-QD capability |
| Ideal for testing large file transfers and cache behavior in real conditions. | Not suitable for small-block or random I/O |
| Exposes SLC cache exhaustion and write-cliff behavior clearly during large transfers. | Doesn’t log per-operation latency or IOPS |
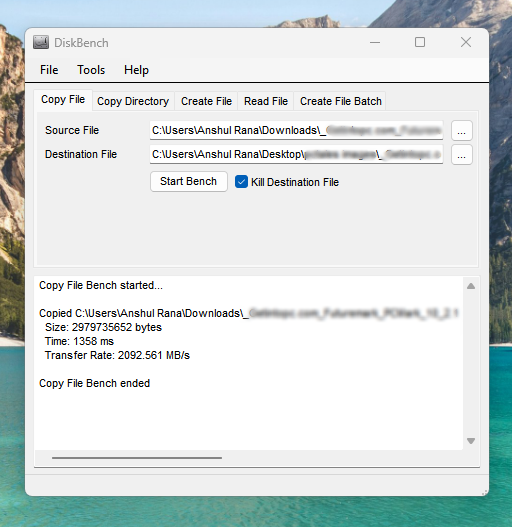
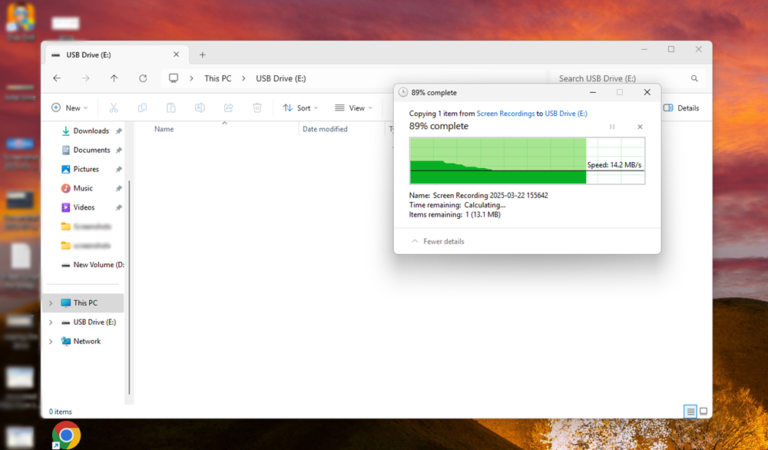
You just select the file or directory on the computer, then choose the destination file where it will be moved. Once the file transfer is complete, you get the total time taken for this move and the transfer rate in MB/s.
Now, professionals use this benchmark to curate and copy different types of files. e.g., a set of random files or big video files (sequential data). This gives us realistic numbers on how long a specific type of file will take to move from one folder to another. You can choose between different drives and see the difference in the file copying. Other tests are for creating files, reading files, or creating batch files. All in all, DiskBench is a great benchmarking software for calculating your drive’s performance in moving files here and there. The ideal file size for testing different performance parameters is as follows.
| File Size | Recommended Use |
|---|---|
| 1GB – 4GB | Typical file transfers (movies, game installs). |
| 10GB – 20GB | Stress testing sustained performance on SSDs. |
| < 1MB | Testing small file performance (important for OS and app drives). |
Conclusion
I use these SSD benchmarking software in my daily work, so I was able to explain it to you using my screenshots. I hope this article will be of help to you. The comments are always open for your feedback. Thanks for reading!

very informative articles or reviews at this time.
Thank you.