Affiliate Disclosure: This post may include affiliate links. If you click and make a purchase, I may earn a small commission at no extra cost to you.
How do you define high memory usage in any computer? Generally, you see the running programs and estimate the usage. For a single Chrome tab with 1 or 2 extensions enabled, you would expect something around 200 to 400 MB of memory usage in the Task Manager. But, what if your system starts to use more RAM than required? Well, there will be a reason for it, and it is very important to find that out.
Memory, or RAM (Random Access Memory), in a computer plays a significant role in holding the active data/code on which the CPU is working. It is called temporary memory because this data is never stored there permanently. Therefore, once an app or game closes, its memory should be freed from most of its content. In some cases, this doesn’t happen. In rare cases, the memory becomes filled with unnecessary data, and sometimes, no memory space is left for the software we want to work on actively.
In operating system design, memory management is one of the most important elements. Engineers implement it through techniques such as paging, segmentation, virtual memory abstraction, memory protection, and dynamic allocation to efficiently allocate, isolate, and reclaim memory across processes, while maximizing performance and ensuring system stability. If you are facing a high-memory usage issue, it is mostly a problem with reclaiming the memory. It not only impacts performance but also reduces the lifespan of your RAM.
Now, this is a general-purpose article, and I can’t tell everybody how to fix memory leaks, debug drivers, or rewrite components. Nor do I know all of these things. However, we can perform the steps that any normal user would do. But, at the end of this article, I promise you’ll be able to fix the problem. So, let’s get started.

How to Fix High Memory Usage in Windows 10/11?
Disclaimer: Make sure you have restarted your system if this issue is happening for the first time. Also, before proceeding, keep a backup of your system because we may touch upon some critical settings. In rare cases, any wrong step might result in irreversible problems. Also, because this is an in-depth and technical article for the problem, I hope you have done the basic troubleshooting like uninstalling unwanted apps and using cleaners like Windows PC Manager.
1. Confirm the problem in Task Manager
All Windows versions, including 10 and 11, come with a useful built-in program called the Task Manager. Let’s have a detailed walk-around of it and confirm the problem. Hopefully, you can identify any specific culprit causing the problem.
To open the Task Manager, press Ctrl + Shift + Esc. Alternatively, you can right-click the Taskbar and choose Task Manager.

The first thing is to look at the memory usage by program and sort from highest to lowest usage by clicking on Memory. As you can see in the image below, we get to know which program is using the most memory and so on. Now, check if the program that you see is really working, or if there is something suspicious here.

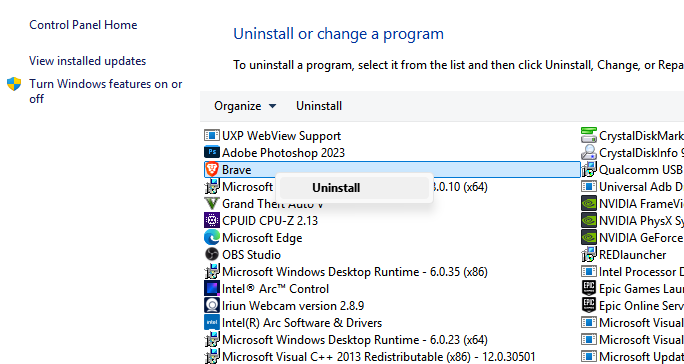
If there is a program that you haven’t installed or don’t need, try uninstalling it from the Control Panel..
Now, go to the Performance tab and click the Memory option. Here, you get details about he memory usage details with a graph view.

At the bottom, you get to see the currently used memory and the available free memory. If the memory usage is higher, Windows also compresses inactive pages to save memory space. Non-paged pool memory is used by the kernel and drivers that can’t be paged out. Paged pool is also kernel-reserved but can be paged if needed.
If you see abnormal paged and non-paged pool memory, this means an issue either with the drivers or the kernel. A good range for non-paged pool is 300–500 MB. The paged pool can occupy up to 800MB. Generally, the issues will be found in the cached or committed memory. We are going to see the solutions later, but these basic steps should help you understand the problem.
2. Investigate Driver Memory Leaks (Non-Paged Pool Growth)
Operating systems separate the kernel memory, which can be paged to the disk. In Windows 10 and 11, the size of the Non-paged pool should stay within 500 MB. Little variations are accepted, but not abnormal growths. We just saw how you can check it. Now, let’s see how you tackle if there is abnormal growth in the Non-paged memory pool. This generally indicates the problem with the internal structure of the operating system, and checking for drive memory leaks is critical here.
To find out memory leaks, we are going to use PoolMon. To use PoolMon, we have to install the Windows Driver Kit or WDK. You can download it from here. Make sure to remember the installation path or change it accordingly.

Once installed, go to the installation location and open the PoolMon.exe program.


What do you have to check in PoolMon?
| Column | What It Means | What to Watch |
|---|---|---|
| Tag | 4-character identifier for memory usage | Focus here first |
| Type | Whether it’s Paged (Pg) or Nonpaged (Np) | We’re watching Np only |
Allocs/Frees | Allocated vs. freed memory blocks | If Frees is much lower → Possible leak |
| Diff | Difference between Allocs and Frees | Higher = worse |
| Bytes | Total memory used by that tag | Sort by this (should already be with -b) |
If you locate any driver with a free memory lower than what it consumes, you just have to note its tag. In my case, I am seeing the 8187 tag. It’s not suspicious, but I am using it as an example. I’ll have to know which drive it is. I can do it using the command prompt only.
For the experts, just enter the drivers directory in the command prompt.
For beginners, get into the root of the command prompt. You can do it by entering cd .. again and again. To make things easier for you, press ls and you’ll see all the folders or sub-directories in the selected path. To enter a directory, type cd and the name of the directory after a space. You can then follow the same steps until you reach the driver’s path. It will be located here: C:\Windows\System32\Drivers>.
Once you are in the Driver’s folder, enter this command and replace the tag with the tag of your suspicious driver. I am replacing it with 8187.
findstr /m /s /l TAG *.sysI get the name of the driver with this command. It is rtwlane.sys.

Now, you can simply do a Google search and find out what type of driver it is. In this case, it is the Realtek PCIE Wireless LAN PCI-E NIC driver. All I have to do now is update the network drivers through the device manager or manually.
3. Disable SysMain (SuperFetch)
SysMain is Windows’ inbuilt function designed to optimize performance by preloading frequently used applications and their data into memory before you open them. It predicts the app usage and learn user habits over time. It is supposed to fill the RAM only with the helpful data, and generally, the size of this data is pretty small. So, if your system has enough RAM, say 16GB or 32GB, it is good to keep this feature turned on. However, for systems with low RAM, there is the process of disabling or replacing the SysMain service.
Open Command Prompt as an Administrator

Enter this command and hit Enter.
sc stop SysMainYou should see a message like this:

If you want to prevent it from booting in the next startup, you can enter this command.
sc config SysMain start=disabled4. Adjust Pagefile or Virtual Memory (Manual Tuning)
Pagefile or pagefile.sys, to be specific, is a hidden system file on the storage drive used as virtual memory in a computer. When the RAM is full, Windows will offload infrequently used memory pages to this file and access it from there. Now, permanent storage drives like hard drives or SSDs aren’t the perfect replacement for RAM, but systems use the pagefile to store data in place of RAM. The system never uses this thing if the RAM you have is always enough for the work you are doing.
It is more of a protective mechanism for overflow data from the memory. However, in some cases, Windows can actively offload the idle pages to virtual memory. Some software can also demand a pagefile, like games or Adobe applications. So, it is a good feature to turn on. If you have a fast storage like an NVMe SSD, virtual memory can help you more with pagefile management. To adjust virtual memory or increase its size, you can follow these steps.
- Press Windows + R key and enter this SystemPropertiesAdvanced and hit Enter. You’ll reach the system properties menu. You can go there directly through the Control Panel.
- Now, make sure you are in the Advanced Tab. Click the Settings option in the Performance section.

- Next, choose the Advanced tab and click Change in the Virtual memory section.

4. Adjust the virtual memory based on this table. You can choose to keep the automatic settings but these manual settings are good for systems with low RAM.
| Drive Size | RAM | Suggested Pagefile Size | Notes |
|---|---|---|---|
| 128 GB SSD | 8 GB | 8–12 GB | Don’t go above ~12 GB pagefile |
| 256 GB SSD | 16 GB | 8–16 GB | Safe room for OS + updates |
| 1 TB SSD | 32 GB | 4–8 GB | Plenty of headroom |

5. Scan for Hidden or Unlisted Processes
The Windows Task Manager provides a detailed view of the installed software and their resource utilization. If you want, you can go a little deeper into it with the Resource Monitor. But checking hidden, malicious, and unlisted programs and processes is a little tough. These programs tend to show no traces of their functioning. This way, some of your memory space will never be available to you. Unfortunately, there is no direct way to check and confirm this issue. For this, we can use the Process Explorer. It is an advanced system monitoring tool with various advanced features compared to the Task Manager.
With Process Explorer, you can check running processes and subpages along with the loaded DLLs and handles. You can check the parent-child process tree to locate the source of the running processes.
- Download Process Explorer. Install it in your system and open the program.
- Make sure you expand the scvhost.exe path, which is under winint.exe>>services.exe.

- Now, enable these three options: “Command Line“, “Image Path“, “Integrity Level“, “Company Name” by going to View → Select Columns → Check.


What to look for?
| Symptom | Suspicion |
|---|---|
| Unknown process with no icon | Possibly injected/malicious |
| Random path or unsigned binary | Untrusted |
| High memory with no visible window | Could be hidden miner, RAT |
| No company name in properties | Could be a hidden miner, RAT |
Investigate High Memory Usage
Click on Private Bytes or Working Set. Working Set indicates the memory currently in RAM. Private Bytes shows the memory used by the process alone. Here, you can look at the memory usage that grows over time. This indicates a memory leak. I would look at the descriptions and the companies of the program. Anything suspicious and I am going to kill it first.
Keep in mind that some Windows processes might have no information about the company or the description. I would recommend doing a search on Google before you kill any process.
How to see DLLs or Handles in Process Explorer?
With this tool, you can inspect DLLs and handles as well. In Windows’ memory management, a DLL (Dynamic-Link Library) plays an important role. This file contains code and data that can be used by multiple programs at the same time. You can think of it as Think of it as a shared library that provides functions and resources to other applications, promoting code reusability and reducing memory usage. So, if there is any issue with the DLL, it can cause memory leaks and other issues.
- Go to View → Show Lower Pane and switch to DLL view.


- In DLL view, right‑click any module → Properties → Verify. Unsigned or odd‑path DLLs often reveal malware or adware injections.

Process Explorer is an advanced tool with advanced responsibilities. With this tool, you get to know in detail about the program and its information. Any abnormal memory consumption combined with a suspicious company name and description is most probably your culprit.
Using VirusTotal in Process Explorer
- Resource Explorer also has a VirusTotal feature to check the programs for malicious intent. To use it, just go to Options> VirusTotal.com.com.com> CheckVirusTotal.com.

- Now, with any program, you’ll see the VirusTotal score. If the score is more than 2-3/70, it’s worth investigating further.

Removing Malicious and Hidden Programs
- Once you have found your culprit, just right-click on the process and click Properties.
- Then, go to the Image tab and either copy the path or click Explore to locate the process in the File Explorer. You can delete the program from its roots.

6. Check for Memory Fragmentation & Locking
Normally, the memory should be dynamically assigned to the processes needed. When there is free memory, it should be returned to the available pool. The less-used memory pages should ideally be moved to the pagefile. The OS should be able to allocate large contiguous blocks if needed. This is important for Direct Memory Access and GPU buffers.
But memory fragmentation breaks contiguity. This happens when processes allocate and free RAM in varying sizes. It fragments the memory space into non-contiguous blocks. Memory locking, on the other hand, stops the system from moving the unused memory to the disk. So, it creates issues with memory freeing. Both of these things are useful when used properly for critical processes like drivers, security software, real-time processes, etc. We can check this issue with Windows’ another helpful tool called RAMMap. Let’s see how we can do it.
- Download RAMMap and run it as an administrator after extraction. You’ll see multiple tabs like Use Counts, File Summary, Processes, etc.

- Now, have a first look at the Use Counts tab and check for these things.
| Column | What It Means | Watch For |
|---|---|---|
| Total | Total memory in this category | |
| Active | Currently referenced pages | |
| Standby | Cache available for reuse | Too high = unnecessary cache |
| Modified | Dirty pages not yet written to disk | Normal unless stuck |
| Nonpaged Pool | Locked memory used by drivers (cannot page) | High = driver leak or bug |
| Paged Pool | Kernel memory that can be paged | Moderate levels are normal |
| Driver Locked | Memory locked by drivers | High = drivers may be leaking |
| Large Page | Pinned/locked memory used for performance | If unusually high, investigate |
- Go to the Physical pages tab to check for defragmentation issues. If there are a lot of small “Free” blocks scattered, it means fragmentation.

Use RAMMap to Reclaim Memory (Partial Fix)
This fix is temporary, but you can use the Empty options and reclaim the memory consumed by the cache. For this, click the Empty tab and click all the available options.

However, the permanent solution will be to find the culprits and then remove them using PoolMon or Process Explorer software.
7. Backup, System Reset, and Restore
In the development environments, often the easiest and safest paths are chosen for troubleshooting the issues. It is better to start fresh than to waste your time on fixing the problem, which can be solved effectively in less time. And you are not losing anything at all. All you have to do is take a backup of your important data (whether online or offline) and then reset your PC. Then, restore your system, and you are free from bloated memory, unwanted programs, faulty drivers, and anything else that is unnecessary. Although all the methods that we mentioned are good to use if you like to tinker around and use your geek brain on something useful. But, a reset is often the final and best option for most users.
Conclusion
Most of the steps that we have covered come in the advanced or intermediate level. They are generally used by developers to debug issues and enhance applications. However, we can use them to fix our memory problems as well. I hope this will help you free up your system’s memory. If you have any other queries or feedback, use the comment section.