Affiliate Disclosure: This post may include affiliate links. If you click and make a purchase, I may earn a small commission at no extra cost to you.
After reading one of my recent SSD comparisons, one reader contacted me with confusion about the SK Hynix Platinum P40 and the Samsung 990 Pro. And I was also planning on this comparison. So, I am here with it for you.
Both SK Hynix Platinum P41 and Samsung 990 Pro are high-end Gen 4.0 NVMe SSDs and the flagship products of their respective brands. Interestingly, both brands use their own controllers and NAND flash in their drives, so you can expect excellent firmware optimization and overall efficiency.
The Platinum P41 comes with SK Hynix V7 TLC NAND flash, while the Samsung 990 Pro uses Samsung’s latest V8 TLC V-NAND. In raw throughput and overall features, the V8 NAND is much better than the V7 flash in the P41. The V8 NAND also has more layers and a higher raw speed than the V7.
The Pascal controller in the 990 Pro is much more efficient and faster, and is based on an 8nm process compared to P41’s Aries controller, which is based on a 12nm process.
Both SSDs have their own DRAM with decent sizes, which we will discuss later in the article. The P41 promises sequential read and write speeds of 7,000 MB/s and 6,500 MB/s, respectively. The 990 Pro, on the other hand, advertises read and write speeds of 7,450 MB/s and 6,900 MB/s, respectively.
Because of the similar specifications, both SSDs compete head-to-head in performance. So, let’s compare in this article and reach a final decision.
Theoretical Specifications Comparison
| Specification | SK Hynix Platinum P41 | Samsung 990 Pro |
|---|---|---|
| PCIe Generation/NVMe Version | PCIe Gen 4.0 x4/ NVMe 1.4 | PCIe Gen 4.0 x4/ NVMe 2.0 |
| Release Year | 2022 | 2023 |
| Capacities | 500GB, 1TB, 2TB | 1TB, 2TB, 4TB |
| Sequential Read Speed | 500GB: 7,000 MB/s 1TB: 7,000 MB/s 2TB: 7,000 MB/s | 1TB: 7,450 MB/s 2TB: 7,450 MB/s 4TB: 7,450 MB/s |
| Sequential Write Speed | 500GB: 4,700 MB/s 1TB: 6,500 MB/s 2TB: 6,500 MB/s | 1TB: 6,900 MB/s 2TB: 6,900 MB/s 4TB: 6,900 MB/s |
| Random Read Speed | 500GB: 960K IOPS 1TB: 1,400K IOPS 2TB: 1,400K IOPS | 1TB: 1,200K IOPS 2TB: 1,400K IOPS 4TB: 1,400K IOPS |
| Random Write Speed | 500GB: 1,000K IOPS 1TB: 1,300K IOPS 2TB: 1,300K IOPS | 1TB: 1,550K IOPS 2TB: 1,550K IOPS 4TB: 1,550K IOPS |
| NAND Flash | SK Hynix V7 TLC NAND | Samsung V8 V-NAND |
| DRAM | Yes | Yes |
| Controller | SK Hynix Aries | Samsung Pascal |
| Pricing | Starting at $79.99 (1TB) | Starting at $92.99 (1TB) |
The Samsung 990 Pro is the newer, faster drive overall, with a slight edge in advertised sequential read and write speeds and noticeably higher random write performance. The P41 promises better in some places, especially in random reads, where it nearly matches or even slightly beats Samsung in some capacities. Still, Samsung’s newer NVMe 2.0 interface and faster V8 NAND give it the advantage in consistency and sustained workloads. Pricing favors SK Hynix, though. It’s cheaper while still offering top-tier performance close to Samsung’s.
In short, the 990 Pro is the pick for max performance and heavy multitasking. At the same time, the Platinum P41 offers excellent value for everyday users who want flagship speeds without paying the Samsung premium.
Benchmark Scores Comparison
All the benchmark score comparisons are for the 2TB variants of both drives. The scores for the 990 Pro are with the Full power mode turned off for a fair comparison. With the Full Power Mode turned On, the scores from the 990 Pro will be a little higher than what we will see in these comparisons.
PCMark 10 Full Drive Benchmark
PCMark 10 Full Drive benchmark is a trace-based benchmark that evaluates an SSD’s performance in real-world applications such as photo, video, and document editing, among others. A better PCMark 10 score, a higher bandwidth, and a lower latency mean a better performance from an SSD in day-to-day tasks.
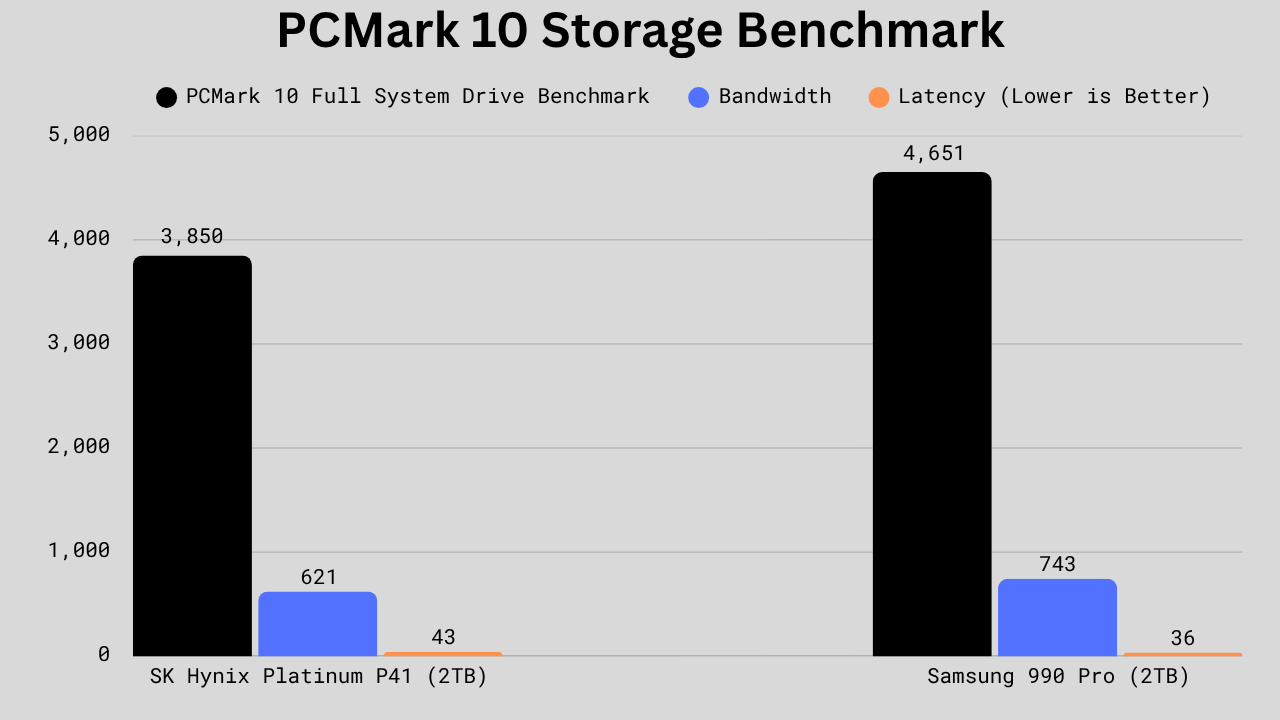
The Samsung 990 Pro beats the P41 in real-world system performance, showing a clear lead in both overall bandwidth and latency. It’s about 20% faster in the PCMark 10 scores (4651 vs 3850) and has lower latency as well. These scores translate into snappier app launches and smoother multitasking from the 990 Pro compared to the P41.
In short, the 990 Pro is better suited for power users who want the fastest, most responsive system possible, while the P41 remains a fantastic choice for those seeking near-flagship performance at a better price.
3DMark Storage Test for Gamers
The 3DMark Storage test for gamers, as the name suggests, runs several gaming-related tests on your drive. Some of the tests check for the performance in gaming, installing, game loading, saving, removing, streaming, and various other scenarios. A better 3DMark score means a better gaming performance from a drive.
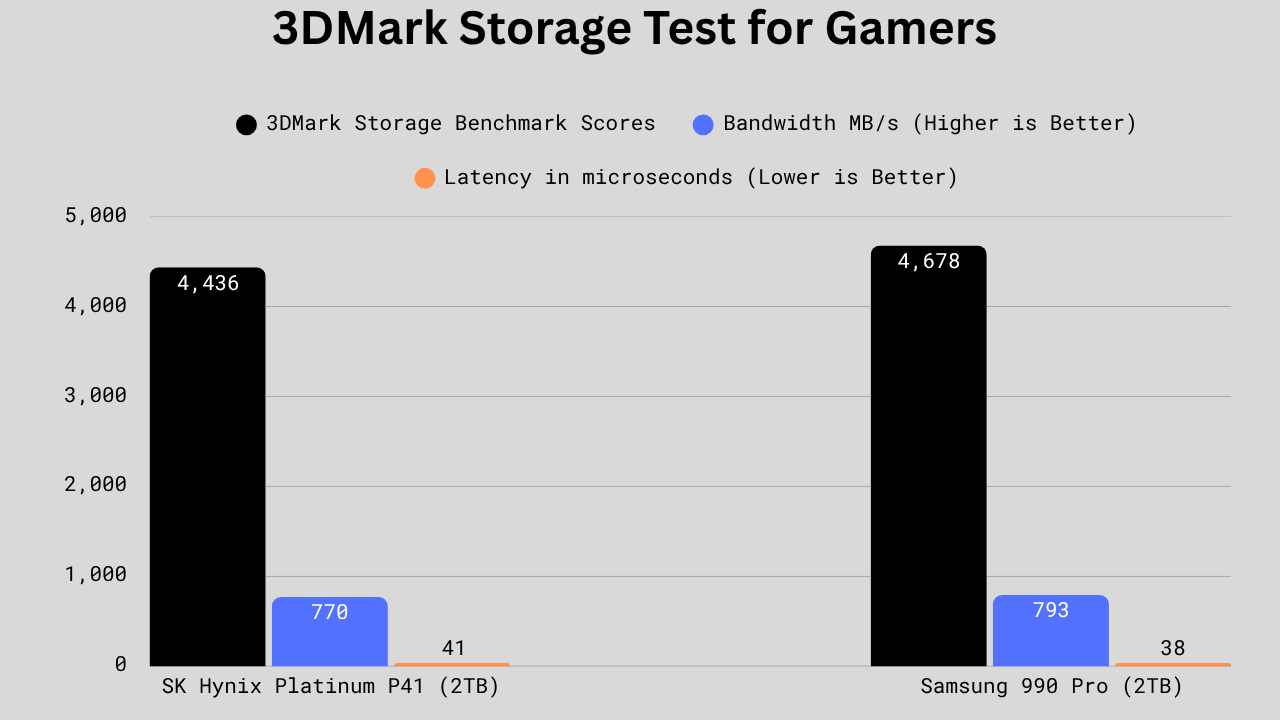
The Samsung 990 Pro again goes ahead with a total score of 4,678, roughly 5.4% higher than the P41’s 4,436. Its bandwidth is slightly better too, 793 MB/s versus 770 MB/s. Not a big difference, but enough to show stronger sustained performance. Latency favors Samsung as well, at 38 µs compared to 41 µs for the P41.
In short, the 990 Pro is the stronger all-rounder for demanding workloads and gaming, while the P41 still holds its own for balanced, efficient everyday performance.
CrystalDiskMark Sequential Read/Write Performance
For the CDM sequential read/write benchmark, we are using 1 MiB data blocks at the queue depths of 1 and 8.
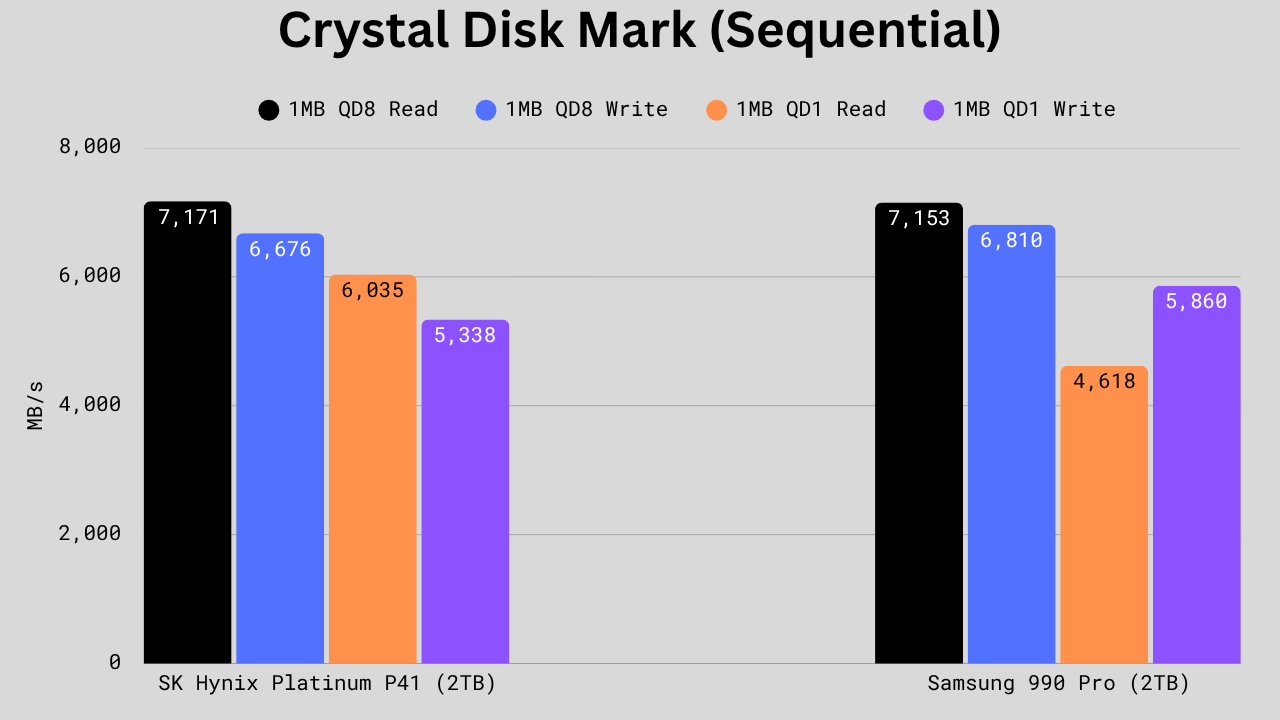
The SK Hynix P41 takes a small lead in 1MB QD8 read with 7,171 MB/s versus 7,153 MB/s. But the Samsung 990 Pro leads in both write tests, especially the 1MB QD1 write, where it hits 5,860 MB/s —about 9.8% faster than the P41. On the other hand, the P41 dominates in 1MB QD1 read, scoring 6,035 MB/s to Samsung’s 4,618. So, we can say that the results are mixed.
Overall, the P41 handles low-queue-depth read tasks better (great for general system use and loading smaller files), while the 990 Pro is stronger for sustained and write-heavy workloads.
CrystalDiskMark Random Read/Write Performance
For the peak random read/write IOPS benchmark, 4KB data blocks are used at the queue depths of 8 and 256.
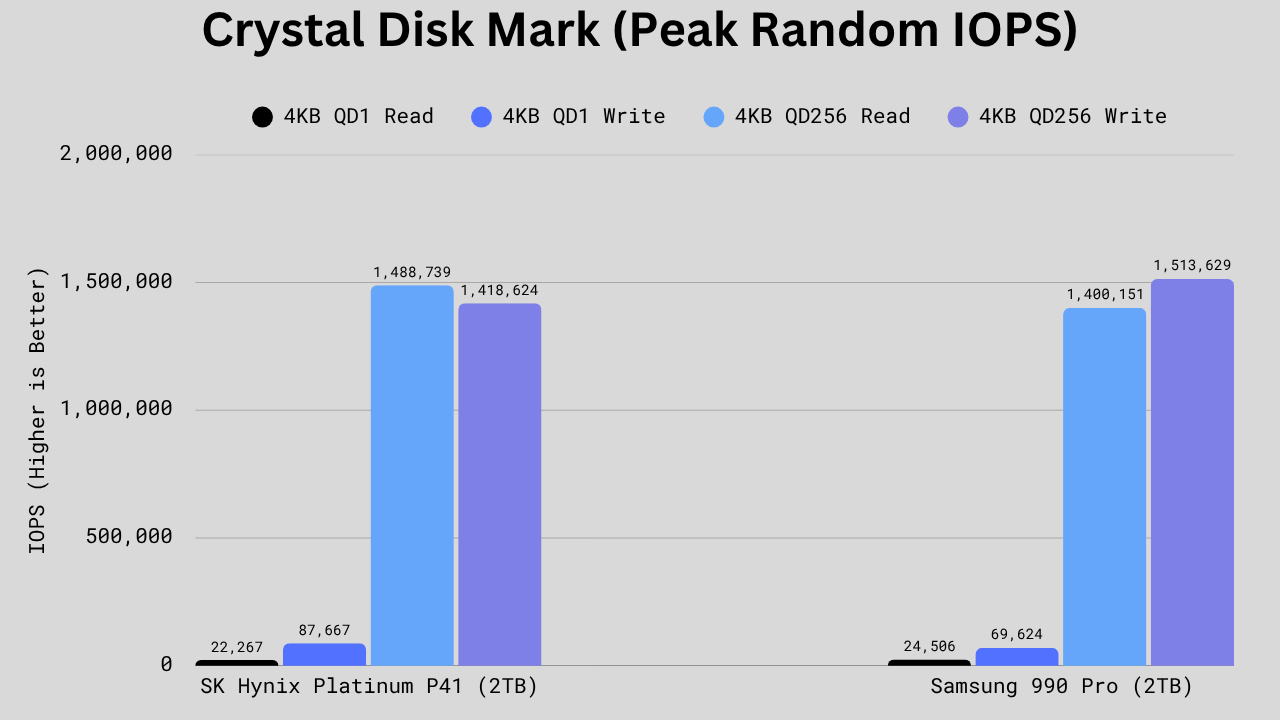
The Samsung 990 Pro shows its power in the 4KB QD1 read with 24,506 IOPS versus 22,267 for the P41 which calculates to about a 10% bump. The P41, though, crushes it in 4KB QD1 writes, hitting 87,667, compared to Samsung’s 69,624, for a solid 25%+ lead. When things ramp up to high queue depths, the P41 keeps its edge in read operations (1,488,739 vs 1,400,151), while the 990 Pro counters with a stronger 4KB QD256 write score (1,513,629 vs 1,418,624).
In short, the P41 feels snappier for small, random write workloads like OS-level caching and background tasks, while the 990 Pro excels when read-heavy or mixed workloads push the drive harder.
File Transfer Rate
The SK Hynix P41 slightly outpaces the 990 Pro in the big copy test, at 1,953 MB/s versus 1,821 MB/s. Both are neck-and-neck in read speed for the 6.5GB zip file, with the P41 at 3,999 and the 990 Pro at 4,014. But Samsung flips the table in write performance, posting 1,905 MB/s to the P41’s 1,869.
Overall, the P41 handles large file copies a bit more efficiently, while the 990 Pro is a touch better at writing large datasets or compressed files repeatedly. We can say this benchmark is again a kind of tie.
Power Consumption and Efficiency
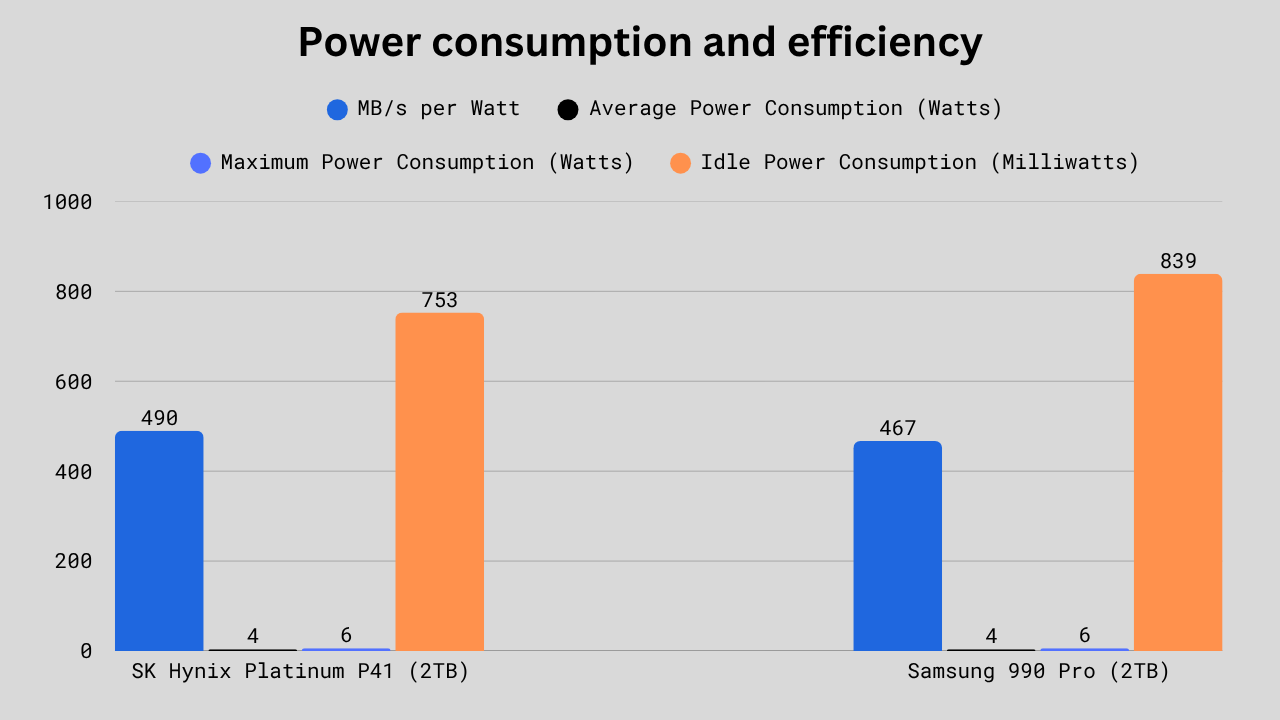
The SK Hynix P41 shows better power efficiency, delivering 490 MB/s per watt compared to the 990 Pro’s 467 which is roughly 5% more performance for the same energy draw. Both drives pull similar average and peak power (4W and 6W), so no big difference under load. Where it matters for idle systems, though, the P41 again comes out cleaner with 753 mW versus Samsung’s 839 mW.
Overall, the P41 is more power-efficient, ideal for laptops or energy-conscious builds, while the 990 Pro prioritizes raw speed over saving a few milliwatts.
Price-to-Performance Ratio
Based on the benchmark scores and the pricing, the P41 clearly offers a better Price-to-Performance ratio. Now, people might also consider the brand when picking an SSD, but SK Hynix also has a reputation in the PC hardware industry. So, there are no issues there. Again, if you want the best Price-to-Performance and Price-per-GB between these SSDs, the P41 is the ideal pick.
TBW, DWPD, MTBF, and Warranty
| Specificiation | SK Hynix Platinum P41 | Samsung 990 Pro |
|---|---|---|
| TBW (Terabytes Written) | 512GB: 500 TBW 1TB: 750 TBW 2TB: 1,200 TBW | 1TB: 600 TBW 2TB: 1,200 TBW 4TB: 2,400 TBW |
| DWPD (Drive Writes per Day) | 0.4 | 0.3 |
| MTBF (Mean Time Between Failure) | 1.5 Million Hours | 1.5 Million Hours |
| Warranty | 5 Years Limited | 5 Years Limited |
Both SSDs are neck-and-neck in endurance and reliability. The 1TB P41 offers a higher TBW of 750, compared to 600 for the 1 TB 990 Pro. The 2TB models share the same 1,200 TBW rating and identical 1.5 million-hour MTBF figures, so neither has an edge in lifespan there. SK Hynix lists a slightly higher DWPD of 0.4 compared to Samsung’s 0.3, hinting at a marginal advantage for heavier daily write use. The 990 Pro, though, has the 4TB model that doubles total endurance to 2,400 TBW, but the P41 doesn’t have 4TB variant at all.
Technical Specifications
| Specification | SK Hynix Platinum P41 | Samsung 990 Pro |
|---|---|---|
| Controller | SK Hynix Aries | Samsung’s Pascal (S4LV008) |
| Controller Architecture | ARM 32-bit Cortex-R8 + ARM 32-bit Cortex-M7 | ARM 32-bit Cortex-R8 |
| DRAM Specifications | LPDDR4-4266 500GB: 1x 512 MB 1TB: 1×1024 MB 2TB: 1×2048 MB | Samsung’s LPDDR4 DRAM 1TB: 1×1024 MB 2TB: 1×2048 MB 4TB: 1x 4096 MB |
| SLC Write Cache | 500GB: – 1TB: approx. 213 GB (205 GB Dynamic + 8 GB Static) 2TB: approx. 320 GB (312 GB Dynamic + 8 GB Static) | 1TB: approx. 114 GB (108 GB Dynamic + 6 GB Static) 2TB: approx. 226 GB (216 GB Dynamic + 10 GB Static) 4TB: approx. 442 GB (432 GB Dynamic + 10 GB Static) |
| NAND Flash | SK Hynix V7 TLC | Samsung’s V8 V-NAND |
| Topology | 176-Layers | 236-Layers |
| NAND speed | 1,600 MT/s | 2,400 MT/s |
| Read Time (tR)/Program Time (tProg) | 50 µs/380 µs | 40 µs/390 µs |
| Die Read Speed | 1280 MB/s | 1600 MB/s |
| Die Write Speed | 168 MB/s | 164 MB/s |
| Encryption | AES-256, TCG Opal, TCG Pyrite | AES-256, TCG Opal |
| SMART/TRIM/PS5 Support | Yes/Yes/Yes | Yes/Yes/Yes |
| More Information | Check Datasheet | Check Website |
Samsung’s 990 Pro clearly has advanced components. Its Pascal controller and 236-layer V8 NAND give it a big jump in memory density and NAND speed (2,400 MT/s vs 1,600 MT/s). The P41’s Aries controller with quad-core architecture is efficient and stable, but a step behind in raw throughput.
SK Hynix gives the P41 a larger SLC cache at each capacity, which helps maintain high write speeds over longer transfers, while Samsung’s cache is smaller but balanced with faster NAND access. Both drives use LPDDR4 DRAM and support full encryption and PS5 compatibility.
Overall, the P41 focuses on consistent, sustained performance and strong caching, while the 990 Pro leans on its newer NAND and faster controller for peak sequential speed and next-gen efficiency.
Price
By the time I am writing this article, the 1TB P41 is available for $79.99, while the 1TB 990 Pro has a price tag of $ 109.99. The 2TB version has the same story, with a saving of around $40 when you choose P41. However, the prices keep changing, and you should double-check them before you make the final decision.
Conclusion: Which One Should You Choose?
If you want the best value-for-money product without compromising on performance and specifications, the P41 is your pick. It offers good thermal efficiency, higher TBW ratings in the 1TB variant, and all the essential features required in any SSD. I would say it gives Samsung a tough time. So, for every penny that you spend on the P41, it will surely be worth it.
However, some people will have a bias towards the Samsung brand and be willing to pay more for the 990 Pro, even though they are not getting anything truly extra. It is true that the 990 Pro performs better in most benchmarks, and with its Full Power Mode, it will score much higher than it does today in this comparison. But you have to pay more for it, and there is nothing wrong with it. If you have some extra money to spend, the Samsung 990 Pro surely offers better reliability and peace of mind.
As a smart consumer, the P41 seems like a much better option with its excellent pricing and competitive performance. But, for those who have a bias towards the Samsung brand, there is nothing much to say.