Affiliate Disclosure: This post may include affiliate links. If you click and make a purchase, I may earn a small commission at no extra cost to you.
Kingston Fury Renegade G5 is Kingston’s flagship Gen 5.0 SSD. The same goes for the Samsung 9100 Pro. Both compete in the high-end Gen 5.0 NVMe category, and it is easy to get confused between the two.
SSDs store data in the NAND flash memory. So, the Renegade G5 has Kioxia’s 8th-generation 3D NAND, called BiCS8. On the other hand, the 9100 Pro has Samsung’s own V8 V-NAND. Both have their own strengths and weaknesses, and you should never choose an SSD based on the NAND specifications. But if I had to pick based on NAND alone, I lean slightly toward Kioxia’s BiCS8 as the more “forward-looking” technology for many uses, even if it has lower storage density. Both SSDs use TLC NAND flash, which is better than some QLC drives out there. You can know the difference here.
The controllers on these SSDs are also somewhat similar. Both are based on the 32-bit ARM Cortex-R8 and have 5 cores. However, the 9100 Pro’s controller is based on a much refined 5 nm process, while the SM2508 in Renegade G5 is based on a 6nm process. Both controllers are DRAM-enabled, and we will discuss the DRAM capacities later in the article.

The Samsung 9100 Pro promises the maximum sequential read speed of 14,800 MB/s and write speed of 13,400 MB/s. The Kingston Fury Renegade G5, on the other hand, advertises 14,800 and 14,000 MB/s. But the real performance will be compared in the benchmarks section. So, without any delays, let’s start our comparison.
Theoretical Specifications Comparison
| Specification | Samsung 9100 Pro | Kingston Fury Renegade G5 |
|---|---|---|
| PCIe Generation/NVMe Version | PCIe Gen 5.0 x4/ NVMe 2.0 | PCIe Gen 5.0 x4/ NVMe 2.0 |
| Release Date | Feb 27th, 2024 | Apr 1st, 2025 |
| Capacities | 1TB, 2TB, 4TB, 8TB | 1TB, 2TB, 4TB, 8TB |
| Sequential Read Speed | 1TB: 14,700 MB/s 2TB: 14,700 MB/s 4TB: 14,800 MB/s 8TB: 14,800 MB/s | 1TB: 14,200 MB/s 2TB: 14,700 MB/s 4TB: 14,800 MB/s 8TB: 14,800 MB/s |
| Sequential Write Speed | 1TB: 13,300 MB/s 2TB: 13,400 MB/s 4TB: 13,400 MB/s 8TB: 13,400 MB/s | 1TB: 11,000 MB/s 2TB: 14,000 MB/s 4TB: 14,000 MB/s 8TB: 14,000 MB/s |
| Random Read Speed | 1TB: 1,850K IOPS 2TB: 1,850K IOPS 4TB: 2,200K IOPS 8TB: 2,200K IOPS | 1TB: 2,200K IOPS 2TB: 2,200K IOPS 4TB: 2,200K IOPS 8TB: 2,200K IOPS |
| Random Write Speed | 1TB: 2,600K IOPS 2TB: 2,600K IOPS 4TB: 2,600K IOPS 8TB: 2,600K IOPS | 1TB: 2,150K IOPS 2TB: 2,200K IOPS 4TB: 2,200K IOPS 8TB: 2,200K IOPS |
| NAND Flash | Samsung’s V8 V-NAND TLC (236-layer) | Kioxia’s BiCS8 TLC (218-layers) |
| DRAM | Yes | Yes |
| Price | 1TB starting at 135.66$ | 1TB starting at 181.95$ |
The Samsung 9100 Pro and Kingston Fury Renegade G5 are both blisteringly fast PCIe Gen 5 SSDs, but they take slightly different approaches. The Samsung 9100 Pro pushes the bar high to 14,800 MB/s reads and 13,400 MB/s writes, showing incredible consistency across all capacities. The Fury Renegade G5 nearly matches it on reads but only reaches those 14,000 MB/s writes from the 2TB tier upward, while the 1TB model lags at 11,000 MB/s.
Random read performance is a dead heat at 2.2M IOPS, but the Samsung drive stomps ahead in random writes with 2.6M IOPS, around 18–20% faster. Samsung also uses denser 236-layer V-NAND, which provides slightly better endurance and efficiency than Kingston’s 218-layer BiCS8. The Renegade G5 is newer and pricier, but the 9100 Pro delivers more balanced, consistent performance per dollar, ideal for professional workloads and enthusiasts who need sustained speed.
Benchmark Scores Comparison
All the benchmark scores are for the 2TB variants of both drives.
PCMark 10 Full Drive Benchmark
The PCMark 10 Full Drive benchmark tests a drive’s capabilities as the primary OS drive. It is a trace-based benchmarking software that actually simulates the real-world tasks like office software, video editing, and gaming-related tasks etc. So, a better PCMark 10 score along with higher bandwidth and lower latency would mean a better performance from a drive in all types of workloads.

Kingston’s Fury Renegade G5 beats the 9100 Pro across the board: PCMark score 6,893 vs 6,597 (about a 4.5% lead) and bandwidth 1,087 MB/s vs 1,037 MB/s (≈4.8% higher). Latency is marginally better on the Kingston too (24 µs vs 25 µs). Those differences are slight but consistent, so Kingston’s firmware/controller gives it a modest all-around advantage in both throughput and snappiness under this full-system test. Overall, Kingston Fury Renegade G5 is the better pick for gaming, desktop responsiveness, and general desktop/workstation use; the Samsung 9100 Pro is still perfectly capable, but it’s the runner-up here.
3DMark Storage Test for Gamers
3DMark Storage test for gamers tests an SSD’s capabilities in gaming-related tasks specifically. The benchmark consists of various tests to check a drive’s performance in game loading, saving, installing, uninstalling, recording, and streaming etc. A good 3DMark score will generally mean a better gaming performance from any drive.

In the 3DMark Storage Benchmark, Kingston’s Fury Renegade G5 pulls ahead with a noticeably higher overall score of 7,337 compared to Samsung’s 6,371, which is roughly a 15% bump, which isn’t minor. Bandwidth follows the same trend, with Kingston hitting 1,232 MB/s versus Samsung’s 1,084 MB/s, showing it can move large game files faster. Latency also tilts in Kingston’s favor, at 24 µs compared to Samsung’s 28 µs, resulting in smoother asset streaming and load transitions. The Renegade clearly dominates this gaming-oriented test, making it the go-to for gamers and enthusiasts seeking performance. At the same time, the 9100 Pro remains a solid, efficient option for mixed workloads or productivity.
CrystalDiskMark Peak Sequential Read/Write Speed
For the CDM sequential benchmark, we are using 1 MiB blocks at the queue depths of 1 and 8.

In the CDM peak sequential read/write benchmark, the Kingston Fury Renegade G5 edges ahead in most places. It is slightly faster in 1MB QD8 write (13,413 vs 13,175 MB/s) and 1MB QD1 write (10,546 vs 10,221 MB/s), suggesting better controller efficiency at lower queue depths. Samsung’s 9100 Pro, however, keeps a tiny edge in low-queue reads (10,218 vs 9,771 MB/s), showing it can handle light sequential workloads just a bit quicker. The differences are all within a few percent, so you’d only notice under sustained transfers. In short, Kingston wins for write-heavy or mixed operations, while Samsung holds a slight advantage in light read scenarios.
CrystalDiskMark Peak Random Read/Write Speed
For the CDM sequential benchmark, we are using 4KB blocks at the queue depths of 8 and 256.

Here’s where Kingston really starts flexing its real power. At low queue depths, it’s clearly more responsive. The 4KB QD1 read speed jumps about 12% higher (28,767 vs 25,745), and its write performance takes an even bigger leap, topping Samsung by nearly 20%. Those are the kinds of numbers that make a difference in everyday snappiness and quick file operations. At extreme queue depths (QD256), both drives perform neck-and-neck, with Kingston slightly ahead in reads but basically tied in writes (1819710 vs 1821311 IOPS). Overall, Kingston’s superior small-block performance makes it the stronger choice for OS drives and gaming, while Samsung’s 9100 Pro still stands tall for sustained, heavy multitasking or data-intensive environments.
File Transfer Rate
Kingston’s Fury Renegade G5 edges ahead just slightly in the copy and read speeds test. In the file copy test, it gets 2,832 vs 2,582 MB/s and 4,937 vs 4,887 MB/s when pulling a 6.5GB zip file. Interestingly, Samsung’s 9100 Pro fights back a little on large sequential writes, pushing 2,294 MB/s to Kingston’s 2,276 MB/s. Overall, Kingston keeps the upper hand for faster data access and general responsiveness, while Samsung remains a rock-solid performer for sustained write operations.
Power Consumption and Efficiency

The Kingston Fury Renegade G5 absolutely crushes the competition in efficiency, with 697 MB/s per watt compared to Samsung’s 457. That’s over 50% better performance for the same power draw. Both average around 4 watts under load, but Kingston spikes to 7W max, whereas Samsung tops out at 5W. The idle draw tells another story: Kingston sips just 1,413 mW while Samsung pulls 1,924 mW, so Kingston’s better tuned for low-power states too. In short, Kingston’s the pick for laptops or energy-conscious setups, while Samsung’s steadier, lower max power makes it a good fit for systems with tighter thermal headroom.
Sustained write speed
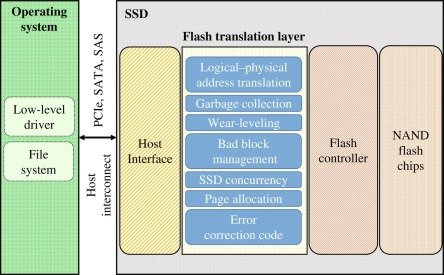
NAND flash, which is used as the primary storage medium in SSDs, has inherently slower write speed compared to the read speed. For some types of data, like random data, this speed can be even slower. So, companies use cache memory to absorb incoming write data and artificially boost write speed. This data is moved to flash memory later, once the SSD is free. However, the size of this cache is limited and once it is emptied, the real NAND write speed can be observed. Below is what I have found about these SSDs.
After the exhaustion of the Pseudo-SLC write cache, the Renegade G5 idles at around 1545 MB/s write speed. The company promises approximately. 2560 MB/s. Samsung promises approximately. 1485 MB/s after cache exhaustion, but the tests averaged around 1485 MB/s. So, Samsung is much nearer to the promised speed, but the Renegade G5 wins in this round as well.
Thermals
Both drives are pretty efficient at heat generation. In most tests, the Renegade G5 stays below 60°C, and in Tom’s Hardware testing, it reached a maximum of 52°C. However, the 9100 Pro can get a little too hot, reaching up to 67°C. So, it’s a good idea to use a heatsink with it. In fact, the 9100 Pro also comes with a heatsink variant.
TBW, DWPD, MTBF, and Warranty
| Specification | Samsung 9100 Pro | Kingston Fury Renegade G5 |
|---|---|---|
| Endurance (TBW) | 1TB: 600 TBW 2TB: 1200 TBW 4TB: 2400 TBW 8TB: 4800 TBW | 1TB: 1000 TBW 2TB: 2000 TBW 4TB: 4000 TBW 8TB: 8000 TBW |
| Warranty | 5 Years | 5 Years |
| DWPD | 0.3 | 0.5 |
| MTBF | 1.5 Million Hours | 2.0 |
Kingston’s Fury Renegade G5 once again comes out ahead in overall endurance and reliability. It offers consistently higher TBW ratings across most capacities. For example, gives 2,000 TBW in the 2TB variant versus Samsung’s 1,200. It also carries a higher DWPD rating (0.5 vs 0.3), meaning it can sustain more daily writes over its lifespan. The MTBF rating tells the same story: 2.0 million hours for Kingston versus Samsung’s 1.5 million. Overall, in the endurance and reliability front, the Fury Renegade G5 again beats the 9100 Pro.
Technical Specifications
| Specification | Samsung 9100 Pro | Kingston Fury Renegade G5 |
|---|---|---|
| Controller | Samsung’s Presto (S4LY027) | Silicon Motion SM2508 |
| Controller Architecture | ARM 32-bit Cortex-R8 | ARM 32-bit Cortex-R8 + ARM 32-bit Cortex-M0 |
| DRAM Specifications | Samsung’s LPDDR4X DRAM 1TB: 1×1024 MB 2TB: 1×2048 MB 4TB: 1x 4096 MB 8TB: 1x 8192 MB | Micron’s LPDDR4-4266 DRAM 1TB: 1×1024 MB 2TB: 1×2048 MB 4TB: 1x 4096 MB 8TB: 1x 8192 MB |
| SLC Write Cache | 1TB: approx. 114 GB (108 GB Dynamic + 6 GB Static) 2TB: approx. 226 GB (216 GB Dynamic + 10 GB Static) 4TB: approx. 442 GB (432 GB Dynamic + 10 GB Static) 8TB: – | 1TB: – 2TB: approx. 670 GB (dynamic only) 4TB: approx. 1300 GB (dynamic only) 8TB: – |
| NAND Flash | Samsung’s V8 TLC V-NAND | Kioxia’s BiCS8 |
| Topology | 236-Layers | 218-layer |
| NAND speed | 2,400 MT/s | 3,600 MT/s |
| Read Time (tR)/Program Time (tProg) | 40 µs/390 µs | 40 µs/- |
| Die Read Speed | 1600 MB/s | – |
| Die Write Speed | 164 MB/s | 205 MB/s |
| Encryption | AES-256, TCG Opal | N/A |
| SMART/TRIM/PS5 Support | Yes/Yes/Yes | Yes/Yes/Yes |
| Datasheet | 990 Pro | Renegade G5 |
Price
By the time I write this article, the 1TB 9100 Pro will be available for $135.66. But the 1TB Renegade G5 is priced at around $193.83. That’s a difference of around 58$. The same goes for the 2TB version. The Renegade G5 2TB is about $30 more expensive than the 2TB 9100 Pro. Other variants have the same price difference.
I just want to say that the Renegade G5 surely has better performance and specifications, but it comes with a higher price tag as well. However, the G5 is relatively new in the market, and the prices may decrease in the future. So, I would recommend checking and comparing them before you make your decision.


Which One Should You Choose? Samsung 9100 Pro or Kingston Fury Renegade G5
In terms of performance, the Renegade G5 clearly beats the 9100 Pro by decent margins. It competes directly with the SN8100. But whether the extra money you pay for it is worth it is up to you. If you are a gamer, content creator, or other professional, this small performance difference may not be noticeable; however, if your work involves tasks that can make use of the heavy Gen 5.0 bandwidth, the Renegade G5 can surely help you. Moving large files will be much faster with the Renegade G5. All in all, it will allow you to make the most out of your Gen 5.0 system.
The Samsung 9100 Pro may look weaker in the benchmarks, but it is a very powerful Gen 5.0 SSD. It delivers good, consistent performance under heavy workloads, along with an efficient controller and high-quality NAND flash. Again, choosing the 9100 Pro over the Renegade G5 will save you money, and in most cases, you will lose almost nothing.
Still, if you want the best of the best between these two, the Renegade G5 is your SSD. Otherwise, there is no serious harm in picking the 9100 Pro and saving some money.